R package to draw synteny plots in three different styles
This package has been developed by Joana Damas (joanadamas@gmail.com), Sarah Quigley (slq4@kent.ac.uk), Denis Larkin (dlarkin@rvc.ac.uk) and Marta Farré (m.farre-belmonte@kent.ac.uk)
It has been tested in Windows 10 R v4.0.3, Windows 11 with R v4.1.1 and v4.2.2 and MAC OS Ventura 13.1
install.packages("syntenyPlotteR")
library(syntenyPlotteR)install.packages("devtools")
library(devtools)
devtools::install_github("Farre-lab/syntenyPlotteR")
library(syntenyPlotteR)We provide a function to modify the output of DESCHRAMBLER or any other synteny tool that creates this type of file:
Alignment output file format for reformat.syntenyData function
Otherwise, you can provide your input Alignment file separated by tabs
DO NOT include a header line
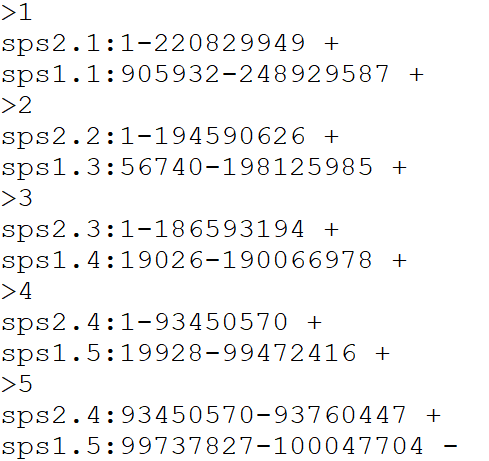
Example input alignment file format for the three functions

Please provide a file containing all aligned species in order from newest species – top of file – to ancestor – end of file, following this format, separated by tabs
DO NOT include a header line
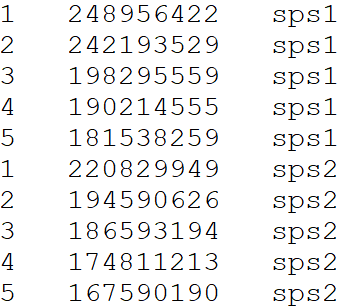
Example file format
The syntenyPlotteR package includes a function to reformat alignment synteny data such as from DESCHRAMBLER or inferCARs - this does not curate files only reformats it
The function outputs a text file containing the reformatted alignment
data As default the function saves the file to a temporary directory,
this can be overridden using the directory parameter
i.e. directory = "path/to/directory".
library(syntenyPlotteR)

reformat.syntenyData("file_data", "output.filename", reference.species = "reference.sps", target.species = "target.sps")There are optional parameters for some customization of this function:
directory = "path/to/directory"reformat.syntenyData("example_map_1.map", "reformatted.data")library(syntenyPlotteR)
draw.eh("output", chrRange, "data_file", fileformat = "png", colour = "lightblue", inverted.colour = "lightpink", w = 5.5, h = 10, ps = 10)There are optional parameters for some customization of this function:
fileformat = "pdf" (the default value is “png”)colour = "red" (the default value is
“lightblue”, see Rcolour pallette for colour options)inverted.colour = "blue" (the default value is
“lightpink”, see Rcolour pallette for colour options)w = 5.5 (default)h = 10 (default)ps = 10 (default)directory = "path/to/directory" (default is save to
temporary directory)Example code using data files in inst/extdata/
draw.eh("outputName", c(17,"X"), "example_eh_alignments_2.txt", fileformat = "pdf")Example output

library(syntenyPlotteR)

draw.ideogram("file_data", "sizefile", "output", fileformat = "png", colours = colours.default, w=8.5, h=10, ps=5)There are optional parameters for some customization of this function:
fileformat = "pdf" (the default value is “png”)colours = c("1" = "red", "2" = "blue", "3" = "green","4" = "orange", "5" = "purple","X" = "grey")
if no colours are assigned default values will be used but colours MUST
be assigned to all chromosomesw = 5.5 (default)h = 10 (default)ps = 10 (default)directory = "path/to/directory" (default is save to
temporary directory)Target is the species which chromosomes will be painted. Reference will be used for painting and diagonals. Chromosomes will be in the same order as in the target sizes file.
Example code using data files in inst/extdata/
draw.ideogram("example_alignment_1.txt", "example_lengths.txt", "example.ideogram")Example output

library(syntenyPlotteR)

draw.linear(output, sizefile, ..., fileformat = "png", colours = colours.default, w=13, h=5, opacity = .5)Please ensure any species identifiers used between length and alignment files are matching (same identifiers and letter case)
There are optional parameters for some customization of this function:
fileformat = "pdf" (the default value is “png”)colours = c("1" = "red", "2" = "blue", "3" = "green","4" = "orange", "5" = "purple","X" = "grey")
if no colours are assigned default values will be used but colours MUST
be assigned to all chromosomesw = 5.5 (default)h = 10 (default)opacity = .5 (default)directory = "path/to/directory" (default is save to
temporary directory)Example code using data files in inst/extdata/
draw.linear("example_linear", "example_lengths.txt", "example_alignment_1.txt", "example_alignment_2.txt", "example_alignment_3.txt")Example output

While our publication is under review, please cite:
Farré M, Kim J, et al. Evolution of gene regulation in ruminants differs
between evolutionary breakpoint regions and homologous synteny blocks.
Genome Research 2019 Apr;29(4):576-589